
Addressing gaps in Canadian AI Maturity and Implementation
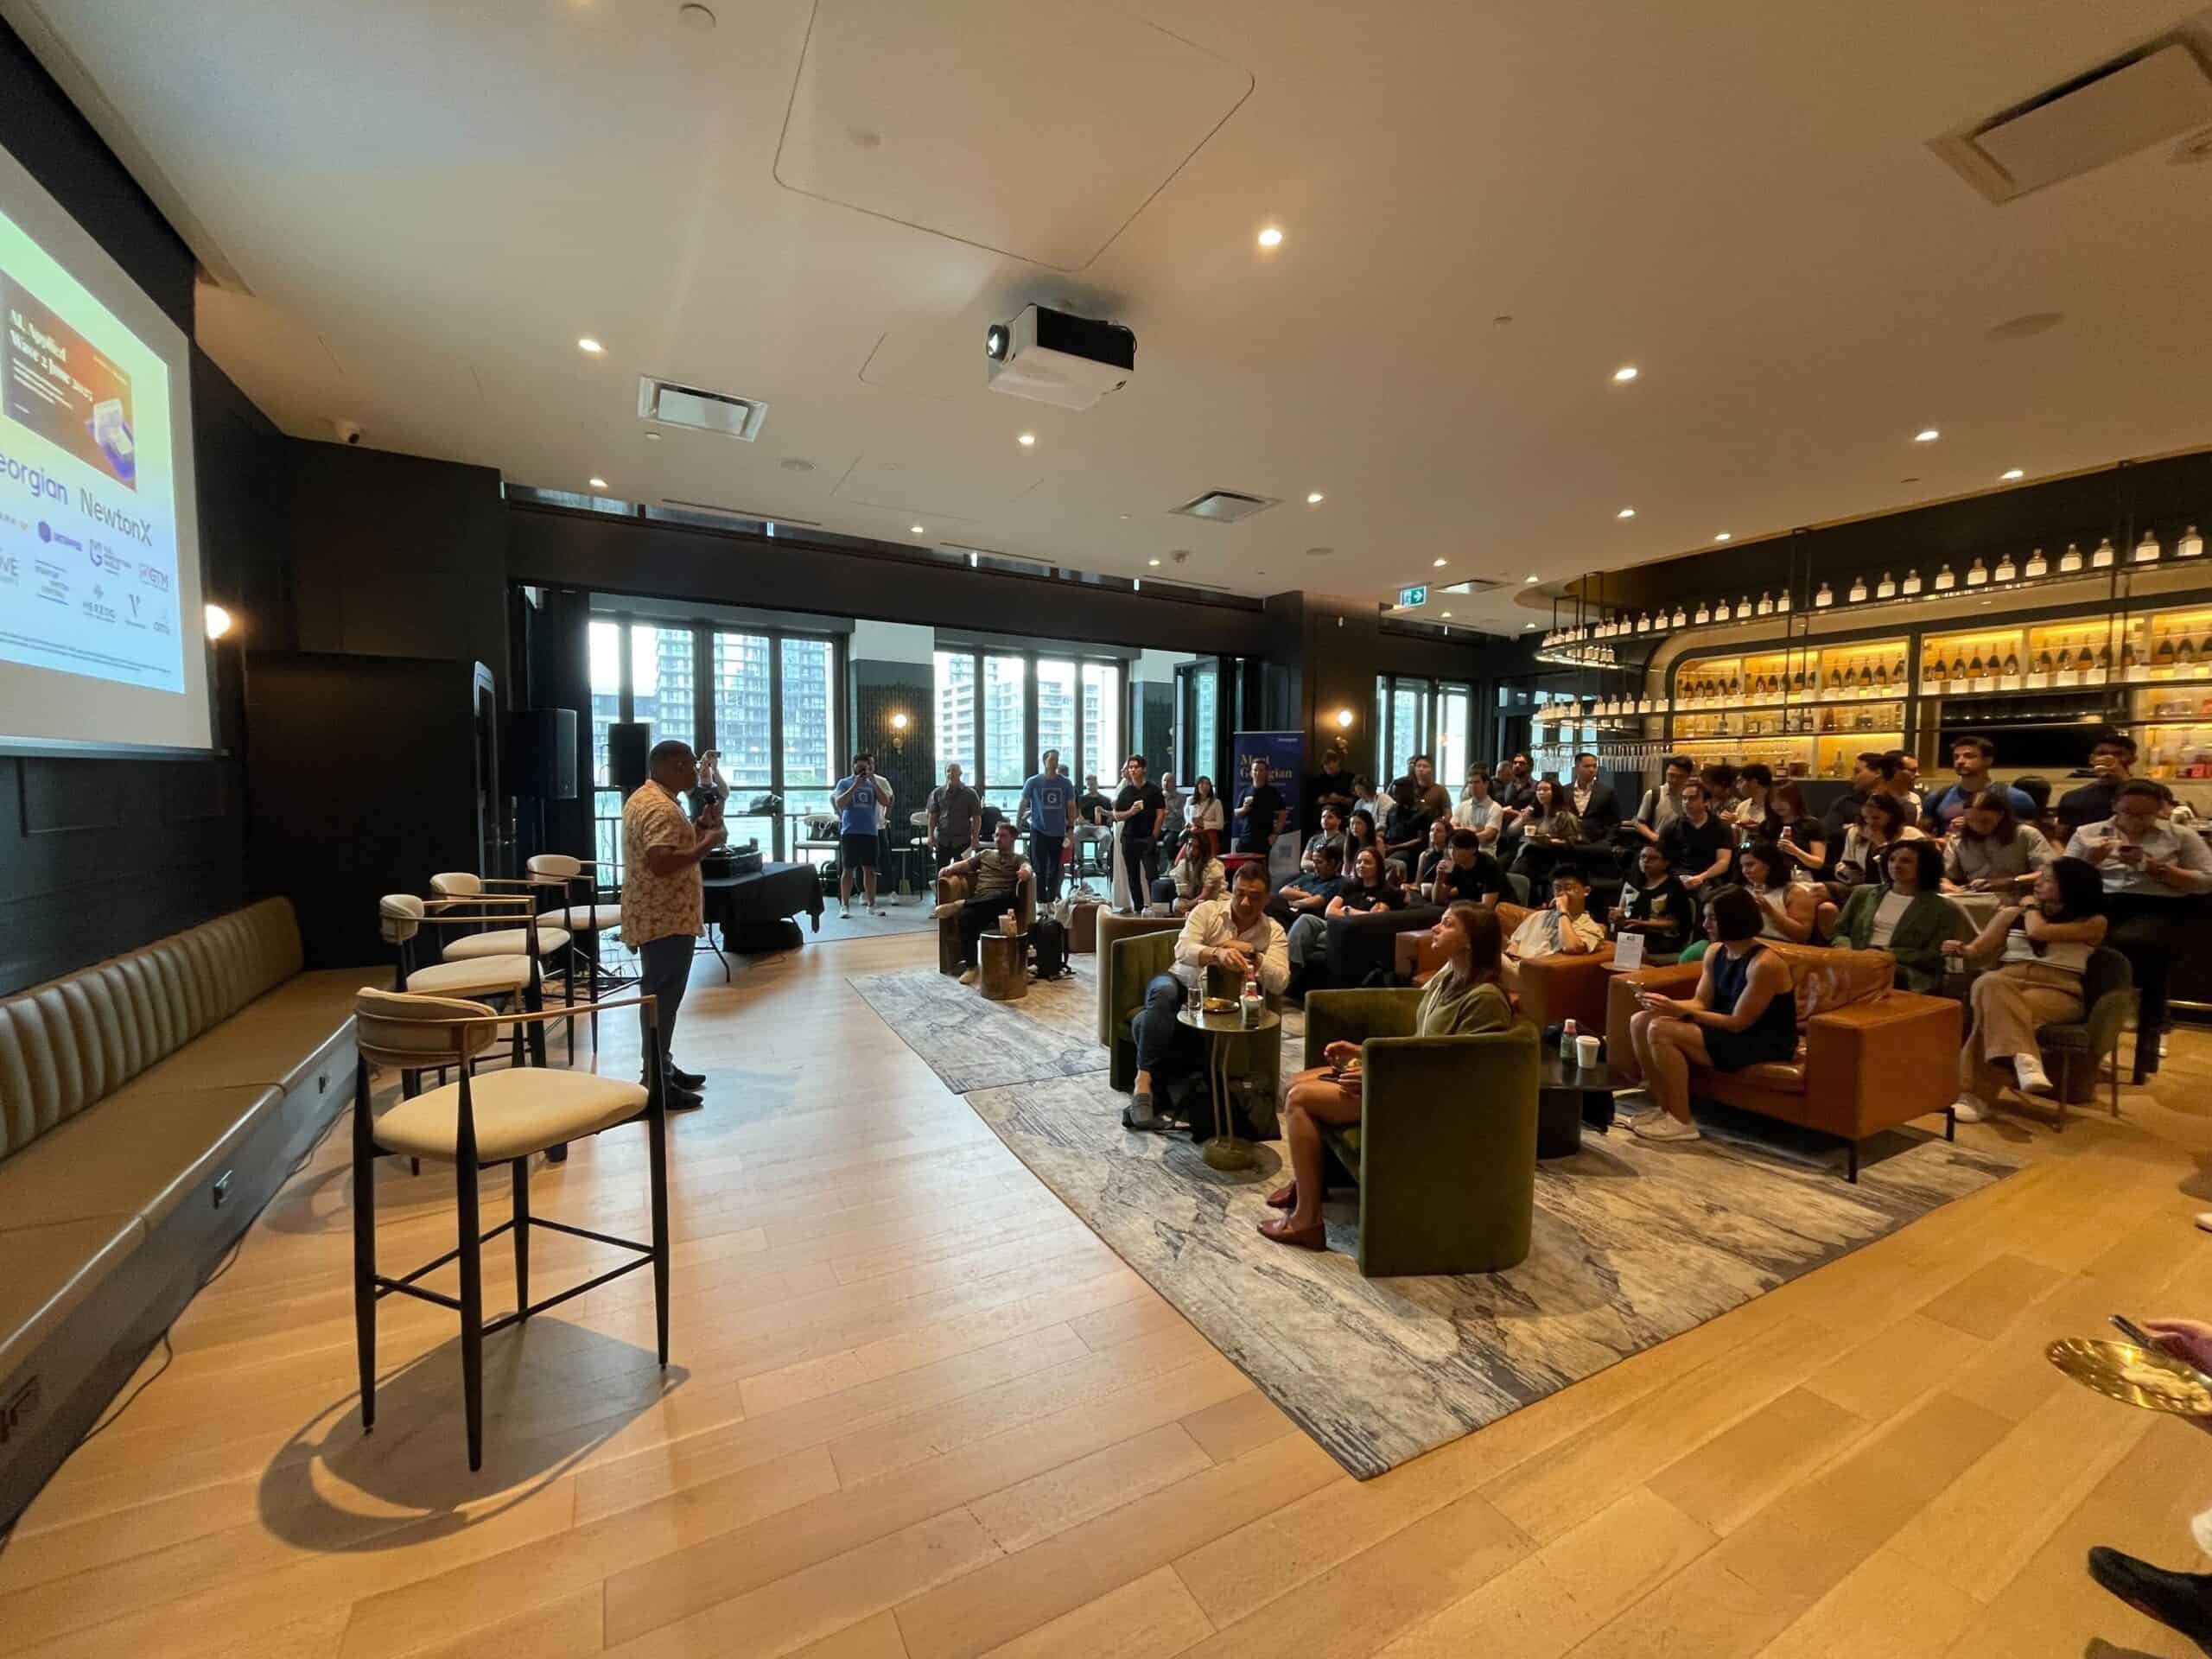
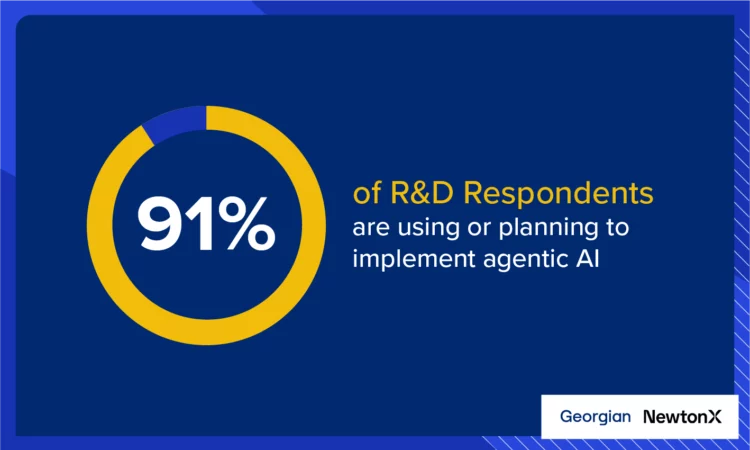
It has been a busy month in Canadian tech; from Toronto’s Tech Week to the publication of four Artificial Intelligence (AI) reports including: Georgian and NewtonX report on Global AI adoption StatisticsCanada report on AI use by Canadian Businesses KPMG report on Global AI adoption RBC report on AI adoption in Canadian companies Toronto Tech…

Technology must-reads
Agentic AI and the Rumors of SaaS’s Demise
Introduction: A Conversation About Big Shifts When I joined Tobias Macey on…
Why Georgian Invested in Island (Again)
Island, the developer of the Enterprise Browser, emerged from stealth in early…
Why Georgian Invested in Render
We are pleased to announce Georgian’s investment in Render’s $80M Series C…
Operations must-reads
How to Use OKRs to Unlock Your Company’s Potential
You’re probably familiar with OKRs — Objectives and Key Results. OKRs are…
How to Tell Your Story to Growth-Stage Investors
So you’re an early-stage startup that’s seeing more customers and more excitement…
G7: The Seven SaaS Metrics Georgian Uses to Evaluate Growth-stage Software Companies
The G7: a new framework composed of the seven most important metrics that we use to evaluate the strength of a growing technology company.